Racebox Mini S Data Recorder Review
We make things that work better and last longer. Our products solve real problems with clean design and honest materials.
UPDATE May 6, 2024: Save 15% on Racebox products by using promo code ULTERIOR15. The original video and article appear below and have not been edited since their initial publication. This is my unbiased and unfiltered opinion of the product for which I paid full price.
A first of its kind product, the Racebox Mini S promises to be a device that can collect lap data without the need for a constant connection to a phone. What that means for us is a rich data set and no longer needing to carry an expensive phone made of glass an aluminum on our bodies. How did it do?
In depth review of the unique stand alone data logging device.
What’s in the box?
Mostly, another box. The unit comes in a nice padded ballistic Nylon clam shell case, handy for keeping everything together and keeping the product safe as you pack up and head for the track. The unit itself measures in at three inches square and one inch tall. Within its truncated pyramid is the GPS unit, memory, magnets, and the battery. It is a very simple block, its only features being the charging port, connection LED light, the Racebox symbol, and a quarter inch threaded insert on the bottom. There isn’t even a switch, as the Mini S is always in standby mode, waiting to be paired. Of course, a charging cable is included, fortunately of the USB/USB-C variety. There are four possible mounting solutions—two are built in and supplies are included for the other two. The threaded insert mentioned above is for camera-type mounts, and the also aforementioned magnets are said to be sufficient for mounting to the surface of ferrous metals such as most automotive body panels. Within the box are also provisions for Velcro mounts and a sticky pad. Velcro seems like the best solution for bikes and, not wanting to risk losing the gadget, the only configuration I tested. A pair of silicone plugs are provided to keep debris out of the charging port while in use on the track and a sheet of paper with quick start directions and QR codes to more instructional content are also included.

Racebox Mini S contents with Velcro applied to base of unit
Mounting for Bikes
As I mentioned above, Velcro looks to be the best medium for motorcycles. Hopefully your bike’s tail section has an adequately flat 3x3 inch surface for mounting. Our SV650 has been rebodied and uses the tail from a 2017+ GSX-R 1000. It lacks a truly flat surface, but it is sufficiently close to flat for this purpose. The 3M adhesive and tenacious grip of the molded Velcro gave me plenty of confidence that the Mini S would stay where it was put. It requires a surprising amount of effort to remove. Having recently lost a GoPro amongst the grasses of Thunderhill Raceway, I was understandably trepidatious at first but after trying it out, my confidence grew.

Racebox Mini S attached using the supplied Velcro to the GSX-R race bodywork on our SV650 track bike
Racebox App
Data collected from the recorder includes lap time, lap count, location, lean angle, and positive and negative acceleration forces. To get things started, all you need to do is tap the connect button on the app and chose your session type from drag, lap, or stand alone. I didn’t find this part particularly intuitive. In fact, I missed a few sessions worth of data because of it. If you choose New Drag Session or New Track Session, you need to have your phone on you—it requires a constant connection. To my mind, that runs counter to the entire proposition of the device. Fortunately there is the Standalone Recording option. That’s the one you want to select. When you return to your phone in the paddock, the data is sent to the cloud for storage. At that point you can begin to analyze it. This all happens rather quickly provided your cell connection is sufficient.
The app is smart enough to know when you are on your in- and out-laps, so while that data is collected, it is not included in the analysis tools. I find that helpful in cutting through the noise. I don’t really care about my speed through the paddock after all.
The first page you see is your session summary, with some basic data including some really interesting highlights. Your Best Lap is helpful of course, but it’s the Theoretical Best which I found pretty intriguing. Because it knows your sector times, it is able to stitch together the best of each to show you what you could have achieved if you could put together a consistently fast lap. I was shocked to see that the delta between my actual fast lap and theoretical fast lap was a whopping three seconds! Min and Max Speed values are shown and in this case showed the nature of riding at The Ridge, registering 112 and 24 miles per hour, respectively. Below that we see a bar graph of my four hot laps from that particular session. I believe there was a red flag that cut it short.

Connection Screen

Session Overview

Single-lap data
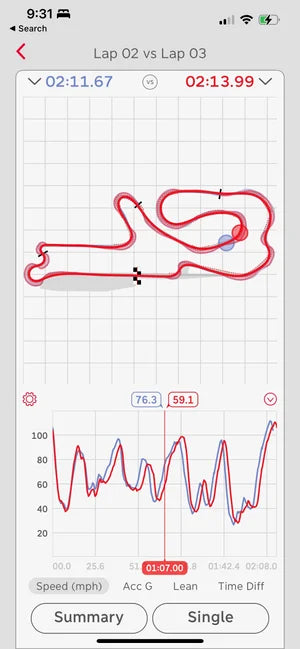
2-lap comparison
Tapping on the fast lap, we see the track map and a waveform graph. Be sure to click on the settings icon to put it into bike mode. This will replace the lateral G values which are useless for motorcycles, with lean angle. While you are in there, set it to smooth out the Acceleration G values. Without smoothing, the signal-to-noise ratio is poor. Tapping on the categories in the legend will increase the transparency of the other values so you can better focus on the one you are most interested in and hitting the down arrow will remove the others altogether. What I would prefer to see here is the ability to see just two of the values at once so I could better analyze their correlation. The app only works in portrait orientation, but fortunately you can pinch/spread the graph so you can zoom in and out for better visualization. Tapping on the compare button allows you to overlay your data with a lap from any session of your data. In the picture below, I chose my fastest and slowest laps of the session. I was able to see that I had lost nearly all of the time in the middle of the first sector when I caught up to some slower bikes.
Racebox Website
Once your session is over, you also have the option of diving into your data on a bigger screen. If you have Wi-Fi at the track, that would be the most useful time to use the website, but it’s also nice to dive in after the fact once you have time to concentrate. The website is very similar to the app, but for some reason there are three differences. While they’re not night and day, one of them is positive and a couple are negative.

Website offers a similar, but slightly different, interface
The first variance I noticed was that I could chose any combination of the three data types (speed, acceleration G, and lean angle) I wanted. I found this really helpful to focus on the correlation of speed and lean angle. For instance, there were times I was knee-down at 44 degrees going 57mph and times I was at 44 degrees going 63mph. Assuming similar body position, I clearly could have been taking the corner significantly faster. The point is underscored when I look at other corners with lean angles of 47 degrees and speeds ranging from 35 to 57mph. The upshot, is there is a lot more speed to be gained. I always knew that. What I didn’t know before now was exactly where.
Secondly—and glaringly—the website does not support lap time comparison overlays. If you want to see where you gained or lost times on two laps, you will need to return to the app. While we are on the subject of comparisons, there also seems to be no way to compare sector times on either the web or the app.
Lastly, an admittedly minor point, is that there is no option for smoothing the acceleration data on the website. All the noise that I mentioned that the app could filter out is present on the website as you can see in the above screenshot.
Video Overlay
Racebox offers an easy way of exporting your file in one of three types; CSV, VBO, and GPX. These files can be imported into various race software applications. I would like to use the data to improve video telemetry overlays that go beyond the basics of speed and track position that GoPro offers with their “stickers”. When you proceed to download a CSV file from your session, Racebox provides information about the CSV options and customizes the data based on the application you chose. They acknowledge that Telemetry Overlay will offer lean angle with their next release, Race Render can support lean angle with some customization, and Serious Racing discards it altogether.

Data exported in CSV format for other applications
With the aforementioned exception of lean angle, Telemetry Overlay does appear to be an excellent choice. Their overlay graphics are beautifully designed and would seem to make a nice companion to the Racebox dataset. Unfortunately there is no free trial version to test out, even for a limited time, and the princely sum of $149 is a barrier to entry sufficient enough to keep me on the outside looking in.
Based on this information, I naturally chose Race Render for its ability to display as much data as possible. Unfortunately, even after all the hassle of syncing your data to your video and reconfiguring lateral G forces to lean angle, the display is inaccurate. As far as I can tell, this is not the fault of Racebox—their data is good—but rather Race Render. I went so far as to dive into the spreadsheet and compare it to a questionable value shown in the video overlay. In the picture below, at that very moment, the Racebox data shows a lean angle of 38.9 yet the lean angle bar is only slightly off center. There are also moments where I am at full lean when the video and Racebox data shows me straight up, virtually at zero degrees, that Race Render shows a significant lean angle. I can’t explain it. The upshot is that Race Render only lets you add a lap time visual when compared to a GoPro sticker and its ugly to boot.


Race Render lean angle visuals incorrect
Serious Racing is not a video overlay platform at all. Its main function is data analysis. While it is possible to pair a video from YouTube along side the data, it is basically a different animal. Serious racing does fill in a few of the blanks from Racebox when it comes to data. For example, you can see your sector times and compare them to one another. They also offer an animation, featuring multiple dots racing against each other. There is a limit of four which is really about as much as you can process yourself anyway. As the animation plays out, Serious Racing plots braking and acceleration markers in the form of backward- and forward-oriented triangles, though it does occasionally drop one or two.

Overall Solid Product
The video overlay issue is pretty minor in the big scheme of things. In fact, I didn't even consider it when I was making the purchase—I just really wanted to have the data. Aside from the quirk requiring you select Stand Alone Recording, I felt the Racebox Mini S was very easy to use. Analyzing the data on the app was straight forward and intuitive as was the website. While it lacks some of the bells and whistles of data analysis sites like Serious Racing, I feel it makes up for in having the data immediately available at your fingertips between sessions. If you have any questions I can answer about this product, feel free to hit me up and I will do my best to answer them.
Latest Article

Follow Us


