Dragy Motorsports Data Acquisition Device
We make things that work better and last longer. Our products solve real problems with clean design and honest materials.
Whether you are a track day rider or an amateur racer, getting data is instrumental in your development. Lap times are just the tip of the iceberg. There is much more to be learned from your time on the track and a lot of speed to be gained. That’s where data acquisition comes in, and these days it doesn’t cost an arm and a leg to get it. Dragy recently sent me one of their $180 devices to try out and share the results with my readers. As always, I take no compensation for my reviews so you know I’m giving it to you straight. Besides, I already own a similar device and I’m very happy with it. So what is different about Dragy? Several things as it turns out and its gotten better as I’ve worked with them on some beta versions.
Cut to the Chase
Pros:
Intutive data presentation
Small size
Easy video import/export
Cons:
Constant phone connection required
Mounting could be more secure

dragy mounted to the tank and GoPro mounted to my chin bar
photo: gotbluemilk
How it Works
A little black box is all you really see, and there’s not much more to it than that. The box alone won’t collect the data you need however. The Dragy box does not have onboard data storage so it needs a constant bluetooth connection with your phone, meaning you need it nearby at all times while its recording. If you have a good solution for mounting your phone on your bike, that is the best way to go about it. Otherwise you are stuck (like I was) carrying it inside your leathers. Glass and metal are not ideal materials to have on your body in the event of a crash, so if you go down this path, figure out a better way to store your phone ahead of time.
The dragy box works with all four global satellite navigation systems to determine your position. Operating at 10Hz, the device collects data every 1/10th of a second. The data it shows goes to 1/100th of a second, so that extra decimal is based on their algorithm’s ability to infer your position between measurements a tenth of a second apart. Other units I have used can sample at up to 25Hz which is every 0.04 seconds. The difference is basically how hard that algorithm has to work. If you’re measuring 0-60 times in your Bugatti, maybe that’s not good enough for you, but over the length of a lap, 10Hz will suffice for the overwhelming majority of riders. I know I am not consistent enough to be within Dragy’s margin of error, so whether it’s 0.10 or 0.04 second increments is not that relevant to me. I am plenty satisfied with the quality of the data.

photo: dragy motorsports
What’s in the Box?
Shockingly little, actually. You get the aforementioned black box measuring just 1”x3”x5/8”. It is quite compact. Its narrow edge-lit LED light changes color depending on its mode; a throbbing red while charging or cyan when connected. A charging port is located on the opposite end from the light. There are no buttons, not even for power. Surprisingly, the only branding on the product is on the bottom side. There if you look closely you will also see a couple of rectangular recesses where the magnets reside.
A micro USB charging cable is provided. The now ubiquitous USB-C would be a nice update if they can swing it. I just kept everything in the original box for the most part. I have more than enough cables to keep track of as it is. The last thing I want is to get to the track without the cable I need. That said, the device consumes so little power, using it all day doesn’t require any recharging. You can do that the night before and not worry about it.
For applications on non-ferrous materials, a pair of adhesive-backed steel mounting plates are provided. The 3M adhesive is up to the task as I found out. The odd thing about the plates however is their size. They are about twice the width of the box yet slightly short of its length. Given that the magnets within the box are at either end, this means that one plate alone is insufficient to secure the device. I had initially assumed two were included in case you had multiple vehicles, but it seems both are necessary for just one. This seems like an easy fix for Dragy to make and I hope they do on future models. I would have mounted mine to the tail of my bike, but there wasn’t enough room to mount both plates. My tank is steel so I did not really need them, but I did try them out there just to see how well they worked.


The dragy box measures a mere 3” in length.
Using Dragy
It’s a fairly simple and straightforward proposition to get started; download the app, pair it with your phone, find a mounting location, and you’re good to go. It does have some interesting features to help you keep track of your performance as well as modifications to your vehicle.
dragy•Lap
While you’re charging the box for its maiden voyage, you can download the free “dragy•Lap” app, create your account, including your vehicle description, and pair the phone with the device. This worked as easily as one would expect and there are no charges to use it.

Allow Location

Allow Bluetooth

Add Vehicle

List Modifications
Mounting the Box
Hopefully you’ve identified a suitable location for the box. Since my tank is steel, that was pretty straightforward for me. Of course the tank isn’t perfectly flat on any surface so the magnetic connection wasn’t quite as secure as I’d prefer, but it was adequate. Fortunately for me there are a couple of ridges on either side of the front of my tank. When I returned from a session, I found the dragy had slid sideways but was kept in place by that ridge. A Velcro connection would have been stronger and helped the perfectly flat box to conform to slight surface curvature. That’s not too difficult to do on your own if that meets your needs. That is what I will do going forward. Regardless of the mounting solution you choose, orient the box with the top surface facing up and the light facing forward.

Mount Magnetically to a Steel Surface or...

…use the Adhesive-backed Metal Plates

If you have a flat steel surface you’re ready to go, just point the light toward the front and head out.
Connect and Go!
Once you are at the track, fire up the app and connect to Dragy. The light on the box will illuminate, confirming your connection. The app knows your location, so it’s just a matter of selecting the correct track and the configuration you are running. Take care to make sure you have the correct one. This varies upon the track, but just a quick look around me shows as few configurations as one (Laguna Seca) and as many as 13 (Buttonwillow.) Connect to dragy and hit “GO!” when you’re ready. For me, that meant Thunderhill Raceway Park (With Turn 5). Make sure your phone is nearby and that’s it. You are ready to hit the track, at least as far as your data acquisition device is concerned.

Select Your Track

Choose the Configuration
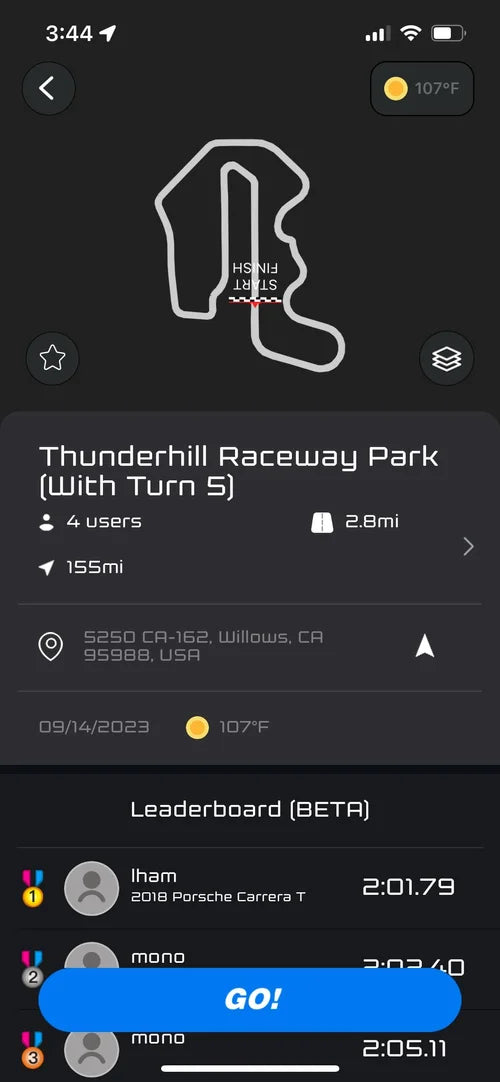
View Map and Hit "Go!"
Consider Video As Well
If you have a GoPro, you’re going to want to use it in your sessions. Its usefulness goes beyond the videos you can share with your friends and frighten family members. I’ll get into why shortly. If you have it, use it and find a way to get it to the Files of your phone. A laptop is handy for that. Uploading video was not a task that was very easily done when I first tested the device in October of 2023, however I worked with the developers at dragy as a beta tester and the video upload functionality has improved greatly. It may not always perfectly sync with your GoPro video, but you can easily adjust that with some simple +/- buttons to dial it in with 0.10s increments.

Combining GoPro video with dragy data is incredibly informative and produces nice looking overlays for export
Analyzing the Data
This is where the rubber meets the road. The entire point of collecting the data is to help you draw conclusions from it and hopefully make you faster. In a track day environment it can be difficult to concentrate between sessions with all the distractions not to mention the fact that you are physically recovering from the prior session. Quickly and clearly identifying your mistakes is essential. Let’s see how dragy did with that.
Getting to the Data
The app is where dragy particularly shines. Tap the “Me” and “History” buttons and select your session. You’re presented with a lot of helpful data from the get go. If you’re into the action footage aspect, now is a good time to add that. Hit the “+ Go Pro” button. You can also do it later if you’re feeling overwhelmed at this point. That would be completely understandable. If you do upload the video, you may need to synchronize it with the data. I’m not sure why this is the case as they both sample GPS data at the same rates. Regardless, it can be well worth it later on.
Choose which session you want to analyze and the topline data a track map appears at the top of the screen, colored in orange and green to denote the slower and faster sections respectively. Tapping on the map will allow you to view an animation of a motorcycle rounding the track at actual speed from a drone-like aerial perspective. Markers denote your minimum and maximum speeds as they cycle up and down, from corner to corner while the speed and lean angle are constantly updated. Adding max lean angle in the corners would be helpful for us riders and I’d think drivers would appreciate their lateral acceleration numbers there as well.

Navigate to History

Select a Session

Animation and Overview
Finding the Opportunities
The animation is entertaining and fairly informative, but going back to the data and scrolling down a bit is where the magic happens. Once you get past the lap times from your session, you’ll see the optimal time. This is the time you could have achieved had you put all your fastest sectors together into one hot lap. Good to know, but how? Glad you asked.
Go to the “Opportunites” section where you are likely to see one or more blue sectors of the track. You will also see times on those sectors telling you how much time you could shave off compared to other laps you rode. This is not hypothetical, these are sector times you accomplished in that same session. A tap on that section reveals more data.
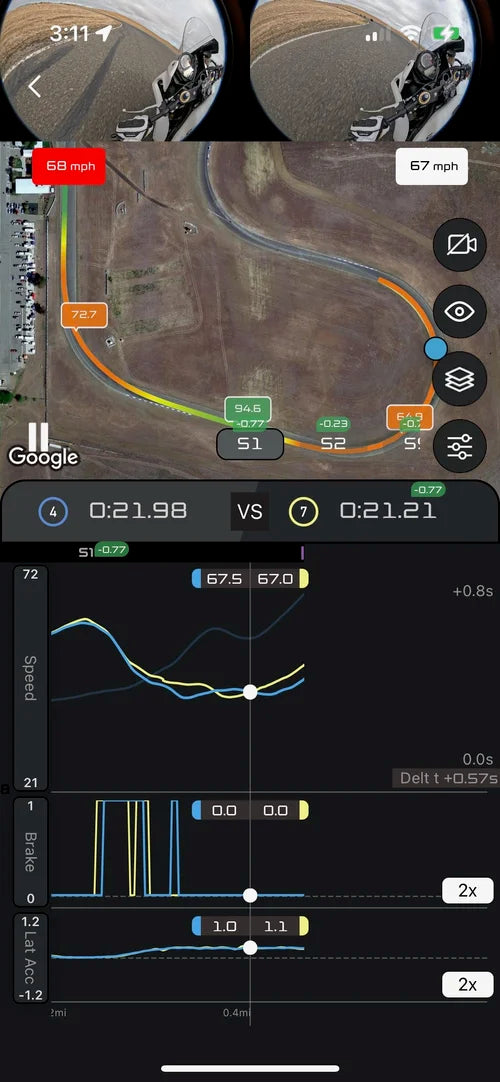
You are presented with the map again. For my example, this is Thunderhill turns one and two, which dragy has broken down into the first sector of the track. A look at the speed graph shows that I entered the sector faster on lap seven shown in yellow than I had on my fast lap, lap four shown in blue. That’s due to getting out of the ninth (and final) sector slower than I should have, but we will come back to that later. Dragging the graph to the right across time shows that my minimum speed through turn one was also greater on lap seven, saving a bit of time.
In turn two is where it gets really interesting. You can see the yellow curve is faster than the blue curve through almost the entirety of the turn, except for one section. This piqued my curiosity so I kept digging. And this is where uploading the video as I mentioned earlier really helps. The videos at the top correspond to the lap data below. I saw that I entered the turn faster, slowed down mid-corner to tighten my line, and as a result, exited faster than I had on my “fast” lap. It would have been easy for me to otherwise assume that traffic was responsible for a slow sector, but I could see for this sector it was not as I had clear track ahead of me. When I looked at the data for sector nine, I could see that I did have traffic there. Honestly it shouldn’t have slowed me up, but being unfamiliar with that rider’s pace, I didn’t carry as much speed through it as I could have, and I paid the price for it in my lap time. That is some extremely usable data right there. I have probably had 20 track days or more at Thunderhill and other than the school I had on my first trackday weekend, this is the most I have learned about picking up speed and it is the most actionable data I have found on a data acquisition device. This feature is so good I am tempted to stop the review right here. But wait, there’s more.

Opportunities

Turn 1 Analysis
Turn 2 Analysis
Video Export
Sharing your track day or testing videos is dead simple once you’ve imported your GoPro footage. Simply return to the session screen, tap on the play button, and tap on export and your video will render and save to your photos with a simple and attractive data overlay. Lap time, track position, lean angle, and speed are all presented clearly around the perimeter of the video. You can also choose to share it with other users on the draggy app or view other people’s videos from around the world if that’s your sort of thing.

Clear and concise realtime graphics overlaid on imported video
Wrap Up
The fact that you need a phone with you to use the dragy is what prevented me from buying the unit outright in the first place. It wasn’t until dragy hit me up for a review that I considered using it. I wanted a self-contained unit because I didn’t want the risk associated with keeping my phone either on my bike or in my leathers. My opinion on that hasn’t changed although I am considering creating a mount of some sort and using an older phone.
It’s the quality of the data presentation that really seals the deal for me about the dragy. The relative ease and quickness with which you can access and learn from the data the dragy collects is remarkable. Add to that the ability to upload video and then download it with the data overlays is the icing on the cake and something other devices I have used have failed to do.
Latest Article

Follow Us


